No, we aren’t about to break out into song like the Glee cast.
Here at BabyPips.com, we’ve got our version of a mash-up, which we like to call the “Time Frame Mash-up”.
This is where multiple time frame analysis comes into play.
This is where we’ll teach you how to not only lock in on your preferred trading time frame but zoom in and out of charts so that you can knock a winner out of the park.
How to Do Multiple Time Frame Analysis to Improve Your Forex TradingYou ready? You sure you can hack this? You’ve basically got a semester left of BabyPips.com’s School of Pipsology?
You don’t wanna quit now, do you?
Didn’t think so!

First of all, take a broad look at what’s happening.
Don’t try to get your face closer to the market, but push yourself further away.
You have to remember, a trend on a longer time frame has had more time to develop, which means that it will take a bigger market move for the pair to change course.
Also, support and resistance levels are more significant on longer time frames.
Start off by selecting your preferred time frame and then go up to the next higher time frame.
There you can make a strategic decision to go long or short based on whether the market is ranging or trending.
You would then return to your preferred time frame (or even lower!) to make tactical decisions about where to enter and exit (place stop and profit target).
Just so you know, this is probably one of the best uses of multiple time frame analysis…you can zoom in to help you find better entry and exit points.
By adding the dimension of time to your analysis, you can obtain an edge over the other tunnel vision traders who trade off on only one time frame.
Did you get all of that? Well, if you didn’t, no worries!
We’re gonna go through an example now to help make things a little clearer.

How to Perform Multiple Time Frame Analysis
Let’s say that Cinderella, who gets bored all day cleaning up after her evil stepsisters, decides that she wants to trade forex.
After some demo trading, she realizes that she likes trading the EUR/USD pair the most, and feels most comfortable looking at the 1-hour chart.
She thinks that the 15-minute charts are too fast while the 4-hour take too long – after all, she needs her beauty sleep.
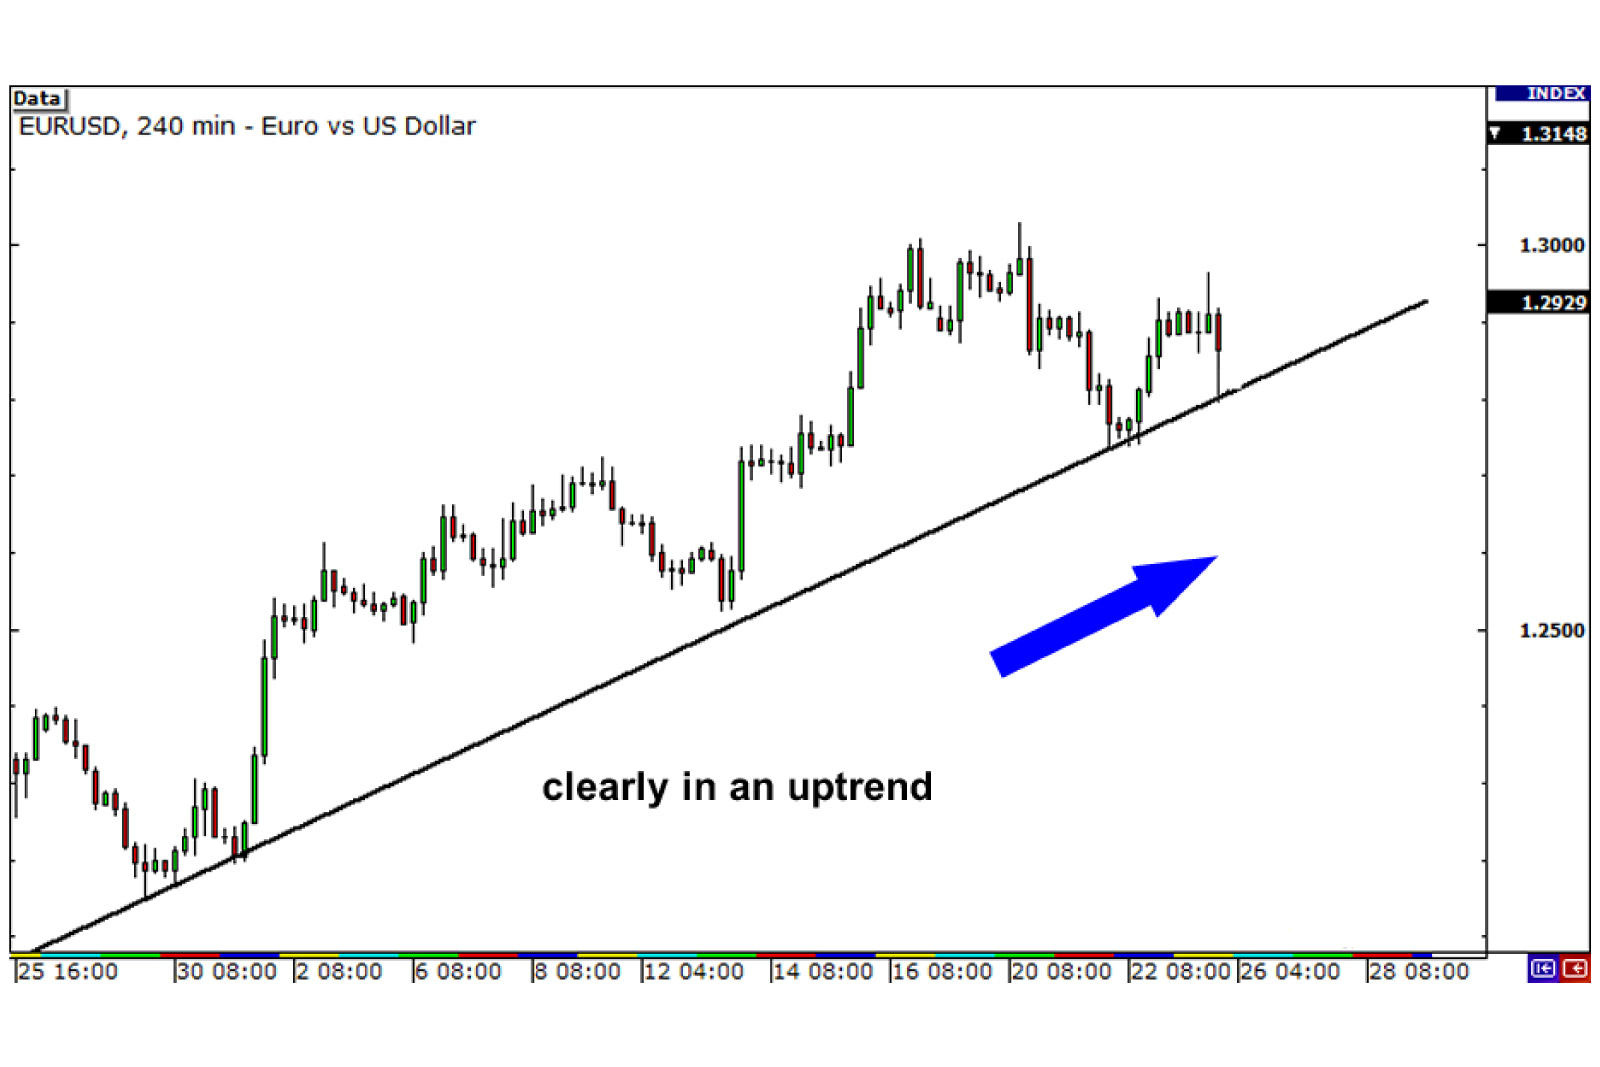
The first thing that Cinderella does is move up to check out the 4-hour chart of EUR/USD.
This will help her determine the overall trend.

She sees that the pair is clearly in an uptrend.
This signals to Cinderella that she should ONLY be looking for BUY signals. After all, the trend is her friend, right? She doesn’t want to get caught in the wrong direction and lose her slipper.
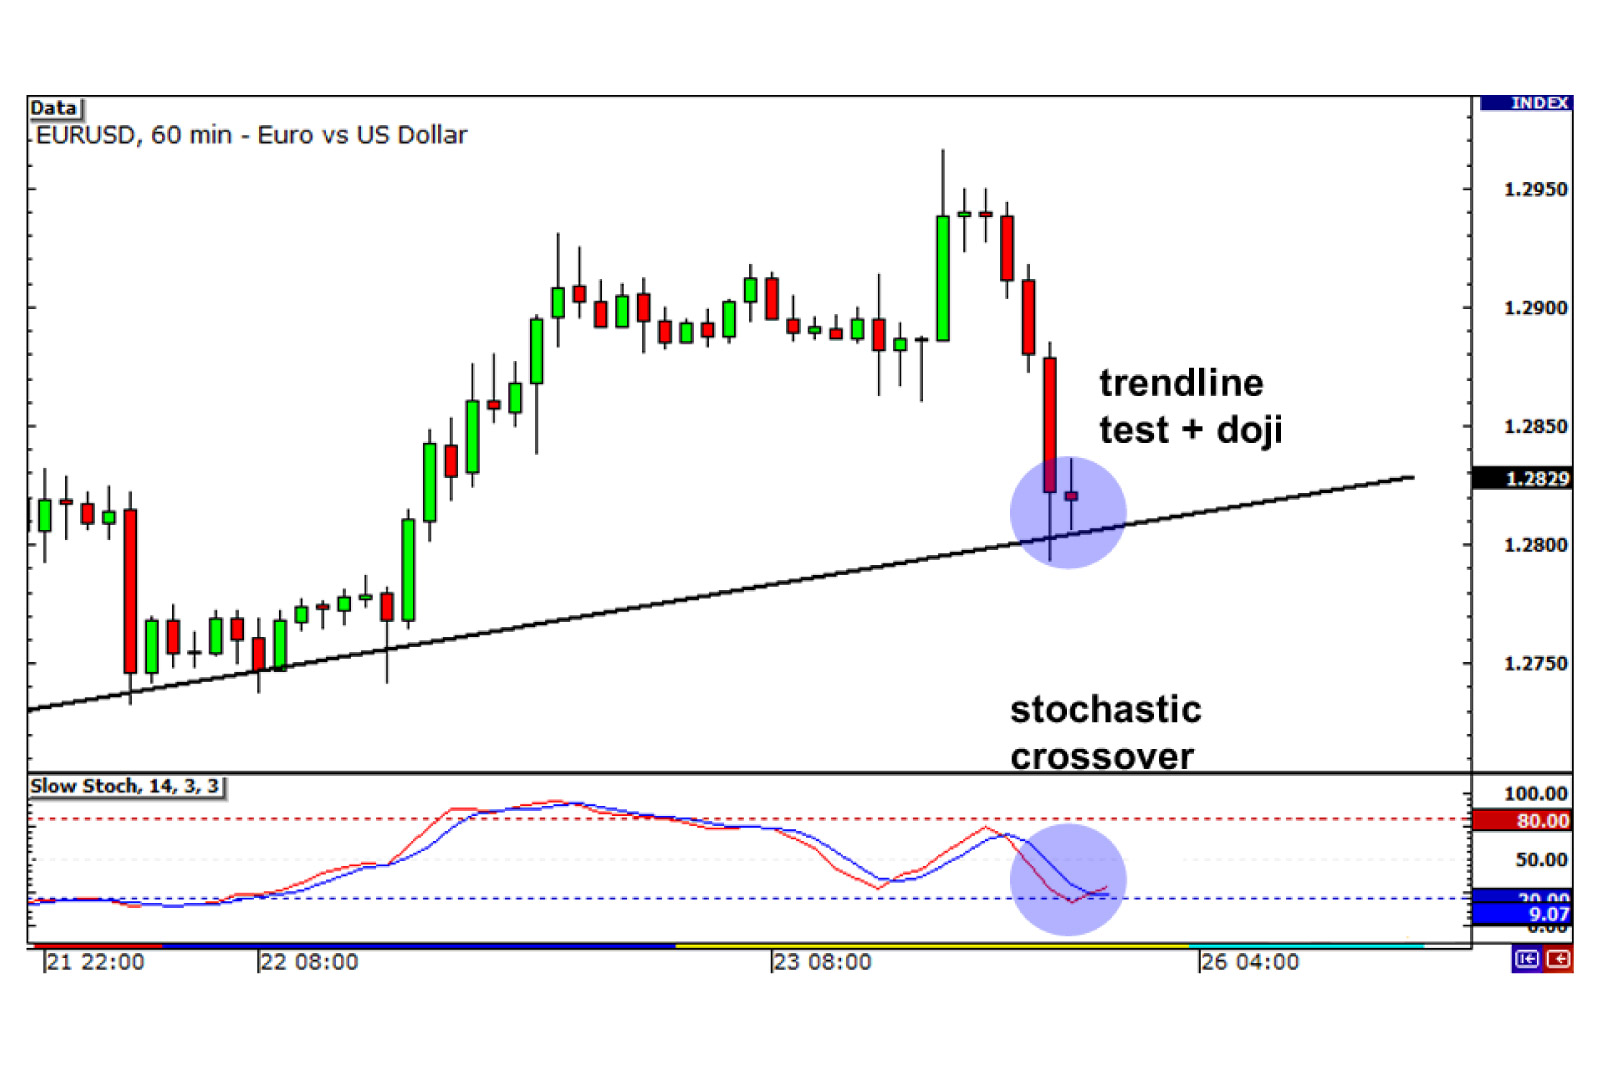
Now, she zooms back to her preferred time frame, the 1-hour chart, to help her spot an entry point. She also decides to pop on the Stochastic indicator.

Once she goes back down to the 1-hour chart, Cinderella sees that a doji candlestick has formed and the Stochastic has just crossed over out of oversold conditions!
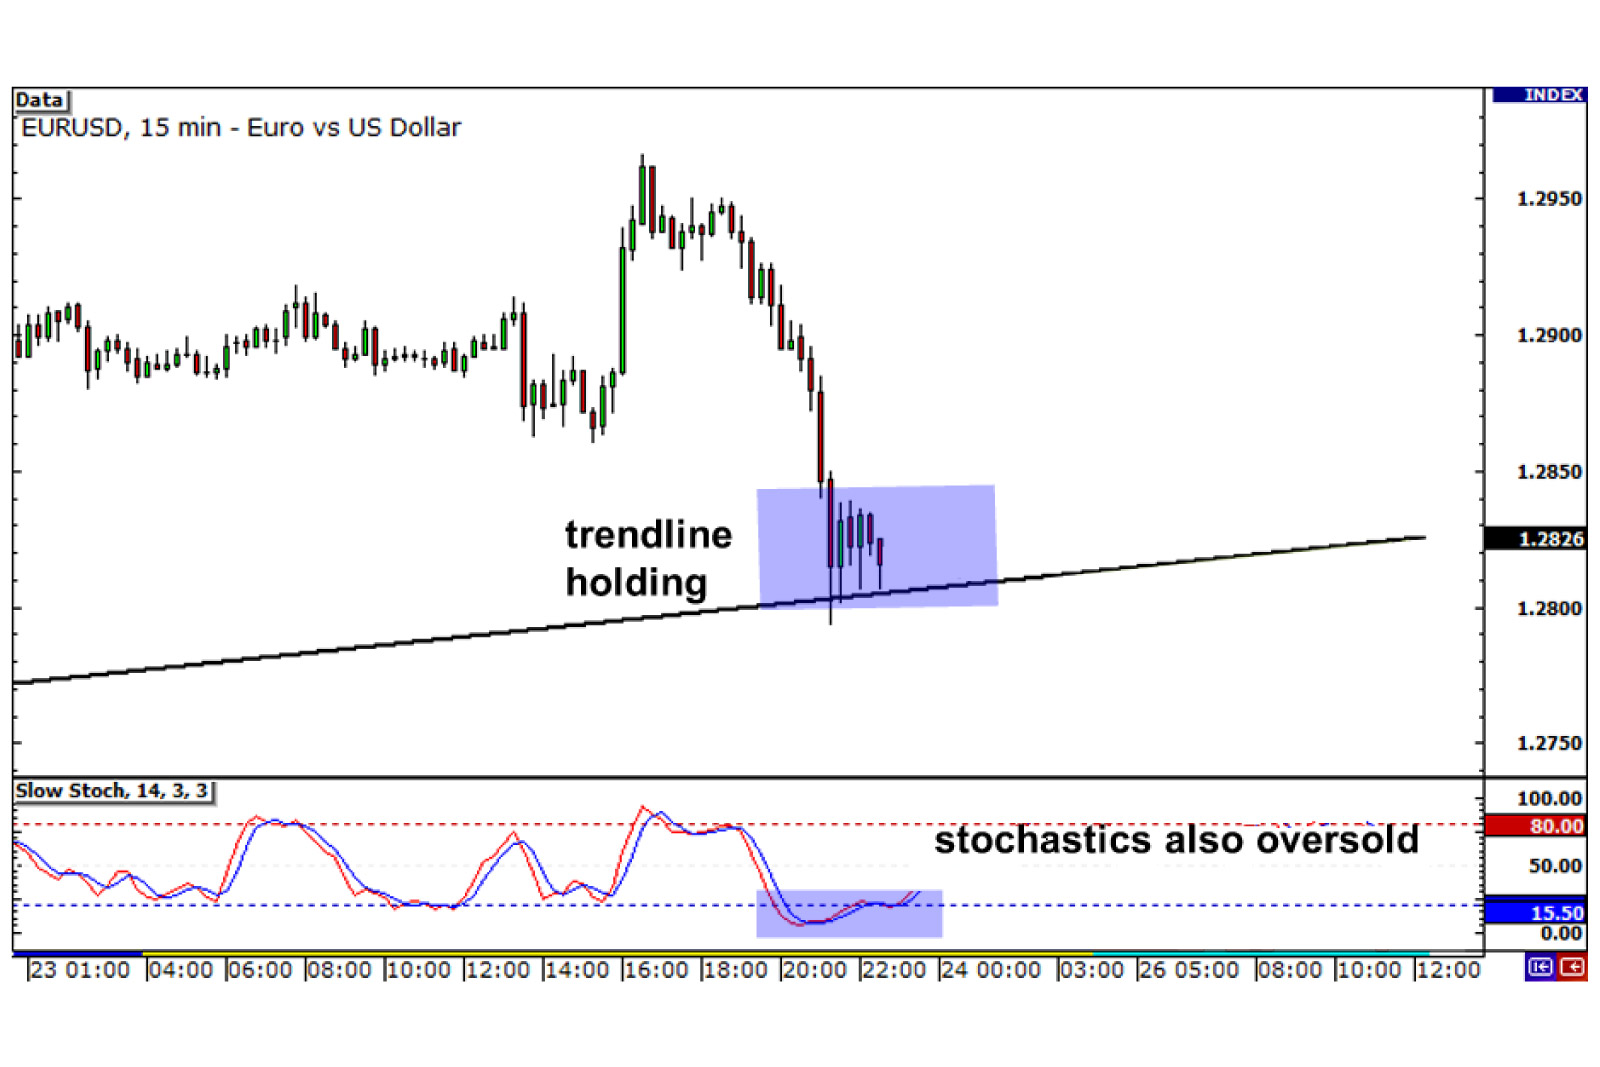
But Cinderella still isn’t quite sure…. she wants to make sure she has a really good entry point, so she scales down to the 15-minute chart to help her find an even better entry and to give her more confirmation.

So now Cinderella is locking her eyes in on the 15-minute chart, and she sees that the trend line seems to be holding pretty strongly.
Not only that, but Stochastic is showing oversold conditions on the 15-minute time frame as well!
She figures that this could be a good time to enter and buy.
Let’s see what happens next.

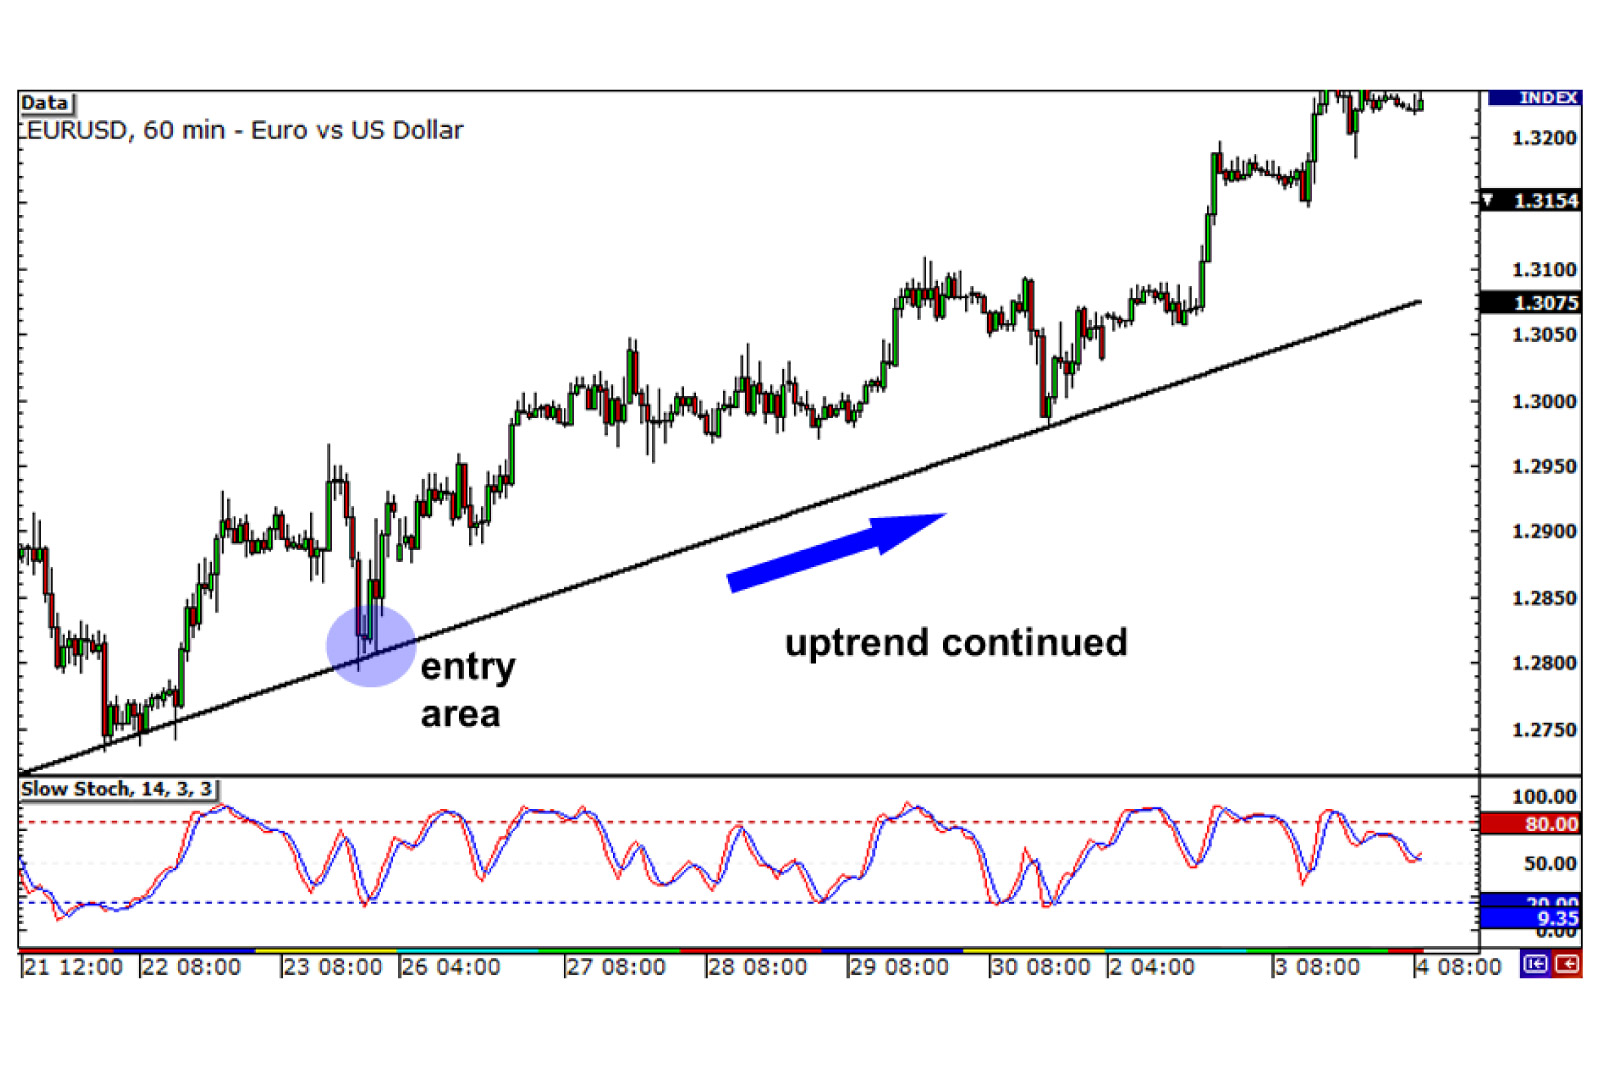
As it turns out, the uptrend continues, and EUR/USD continues to rise up the charts.
Cinderella would have entered just above 1.2800 and if she had kept the trade open for a couple of weeks, she would have made 400 pips!
She could have bought another pair of glass slippers!
There is obviously a limit to how many time frames you can study. You don’t want a screen full of charts telling you different things.
Use at least TWO, but not more than THREE time frames.
Adding more will just confuse the geewillikers out of you and you’ll suffer from analysis paralysis, then proceed to go crazy.
Is there a wrong way to do multiple time frame analysis, you ask?
Some of our forex friends have been nice enough to give their two pips on this matter through this forum thread on multiple time frame analysis.
At the end of the day, it really is all about finding what works best for you.


