Now that we know how to determine sentiment extremes, what’s next?
Recall that not every sentiment extreme results in a market top or bottom so we’ll need a more accurate indicator.
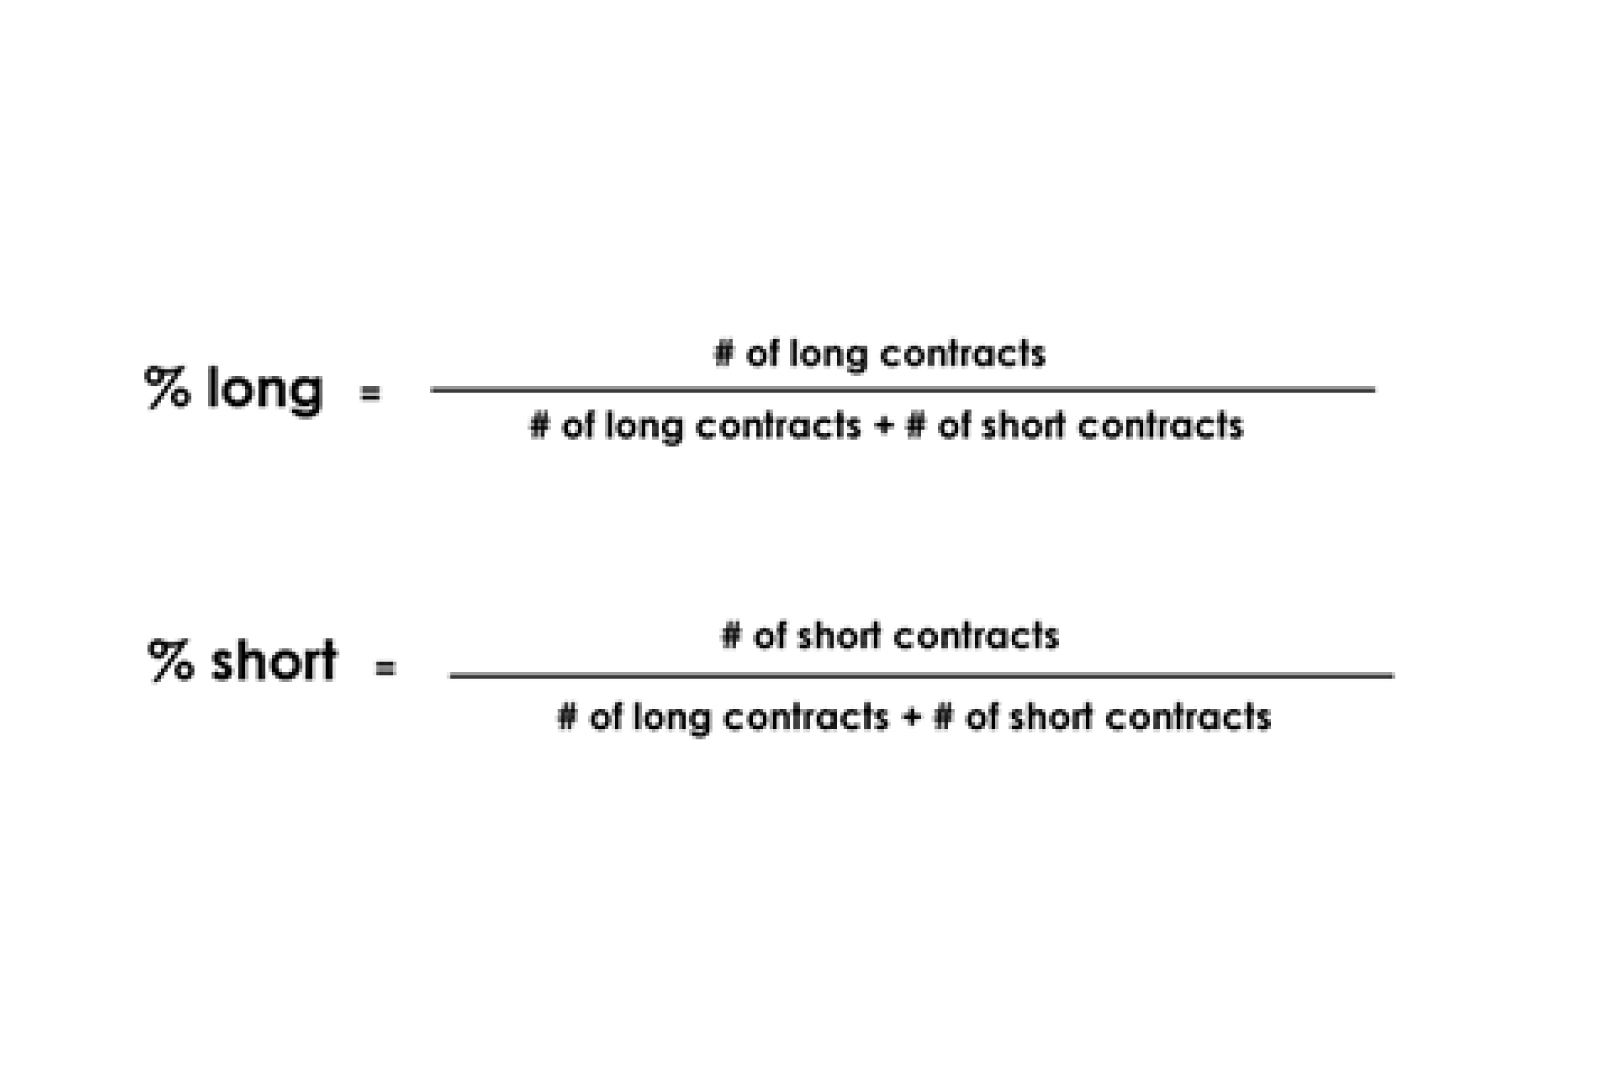
Calculating the percentage of speculative positions that are long or short would be a better gauge to see whether the market is topping or bottoming out.
The equation to calculate for the %-long and %-short is indicated below:

To illustrate this better, let’s go back a few years and see what happened with Canadian dollar futures.
Going through the COT reports released on the week ending August 22, 2008, speculators were net short 28,085 contracts.
On March 20, 2009, they were net short 23,950 contracts.
From this information alone, you would say that there is a higher probability of a market bottom in August since there were more speculators that were short in that period.
But hold on a minute there… You didn’t think it would be THAT easy right?

A closer look would show that 66,726 contracts were short while 38,641 contracts were long. Out of all the speculative positions in August (66,726 / (38,641 + 66,726)), 63.3% were short positions.
On the other hand, there were just 8,715 long contracts and 32,665 short contracts in March.
This means that (32,655 / (8,715 + 32,665)) 78.9% of the speculative positions were short positions during that period. What does this mean?
There is a higher chance that a bottom will occur when 78.9% of all speculative positions are short as opposed to just 63.3%.
As you can see on the chart above, the bottom, in fact, did not occur around August 2008, when the Canadian dollar was worth roughly around 94 U.S. cents.
The Canadian dollar continued to fall over the next few months.
By the time March came around and the %-short ratio hit 78.9%, the Canadian dollar had hit a bottom around 77 U.S. cents.
Then what happened? It started to steadily rise!
A market bottom? Yep, you got it.


