- The dollar’s oversold bounce weighs over gold on Wednesday.
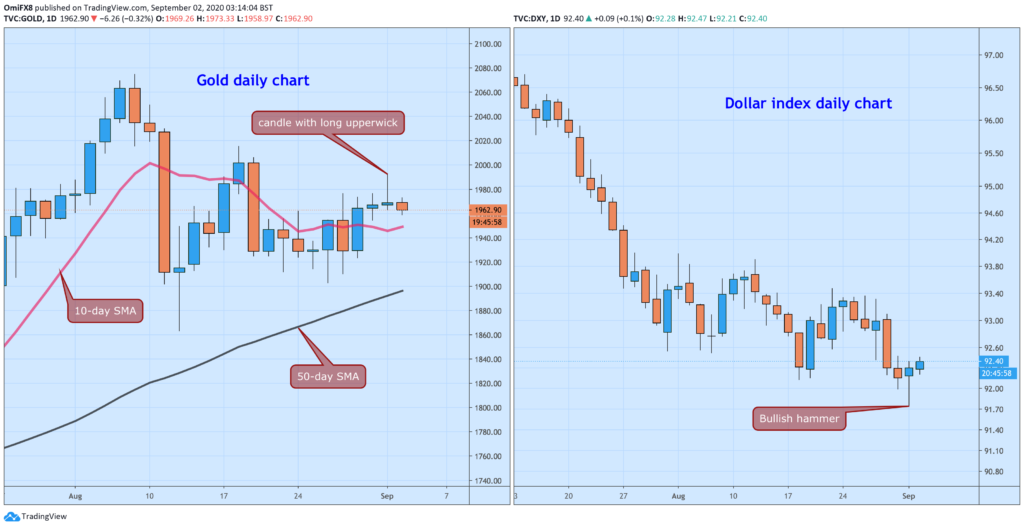
- The yellow metal’s daily chart shows the scope for a deeper price drop.
- The dollar index’s daily chart shows a bullish reversal candlestick pattern.
Gold is feeling the pull of gravity on Wednesday alongside an oversold bounce in the US dollar, the yellow metal’s biggest nemesis.
At press time, gold is trading 0.34% lower on the day at $1,962 per ounce. The dollar index, which tracks the greenback’s value against majors, is seen at 92.41 – up 0.11% on the day.
The yellow metal looks set to extend the drop as there are signs of downtrend exhaustion on the dollar index’s daily chart. The greenback carved out a classic long-tailed hammer candle on Tuesday, indicating a potential for a robust corrective rally. The 14-day relative strength index’s bullish divergence also shows scope for a significant bounce in the dollar.
Meanwhile, the long upper wick attached to gold’s Tuesday’s candle reflects a sell-on-the rise mentality.
The metal could test the 10-day simple moving average support, currently at $1,949. A violation there would expose the 50-day SMA located just below $1,900. On the higher side, $2,000 is the level to beat for the bulls.
Gold and dollar index daily charts


